Transform your data into interactive map dashboards.
No coding. No servers. In minutes.
Effortless Data Import
CSV & Excel Drag & Drop
Simply drag your spreadsheet onto the map. Supports .csv, .xlsx, and .xls files of any size.
Intelligent Column Detection
Automatic recognition of country names, ISO codes, coordinates, and numeric values. Zero configuration needed.
Multiple Data Sources
Layer multiple datasets on a single map. Combine population data with trade routes, or sales figures with logistics networks.
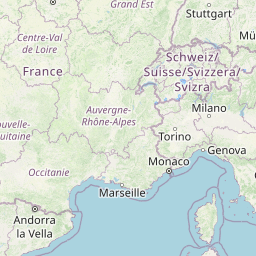
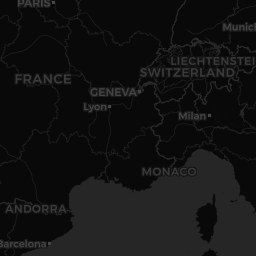
10 Map Styles
From satellite imagery to minimalist vector tiles — choose the perfect backdrop for your data story.
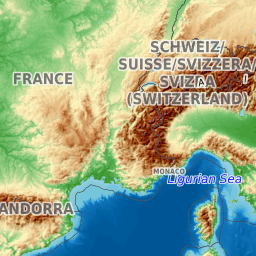
Terrain
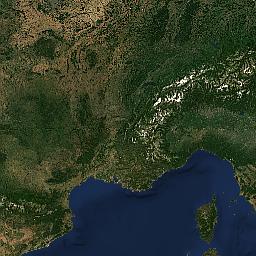
Satellite

Dark
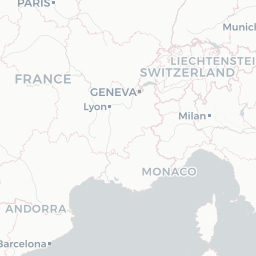
Positron
Liberty

Dark Matter
Fiord

Bright
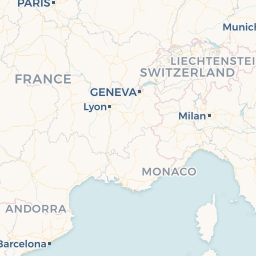
Voyager
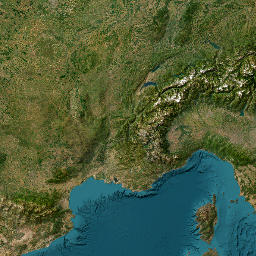
Satellite Labels
8 Visualization Layers
Stack and combine layers to reveal patterns invisible in raw spreadsheets.
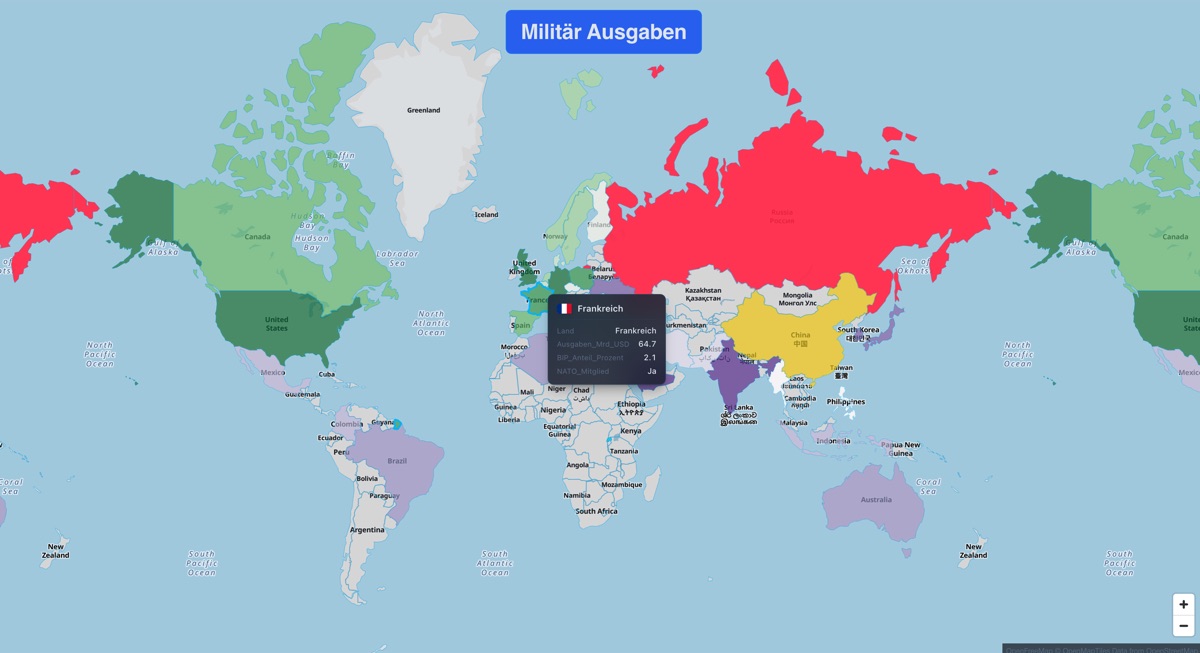
Choropleth
Color-fill countries or regions by value. 21 built-in shapefiles included — or upload your own GeoJSON/Shapefile.
Points
Place precise markers on exact coordinates. 6 built-in shapes, or upload your own SVG icons.
Bubbles
Size-scaled circles that encode magnitude. Great for city populations or revenue per office.
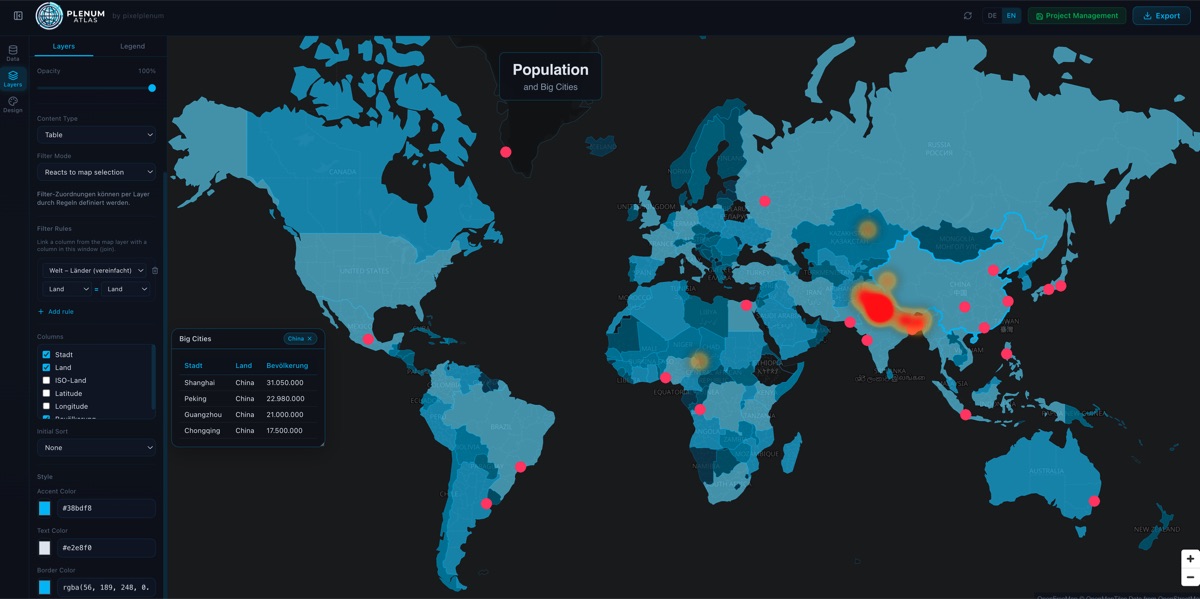
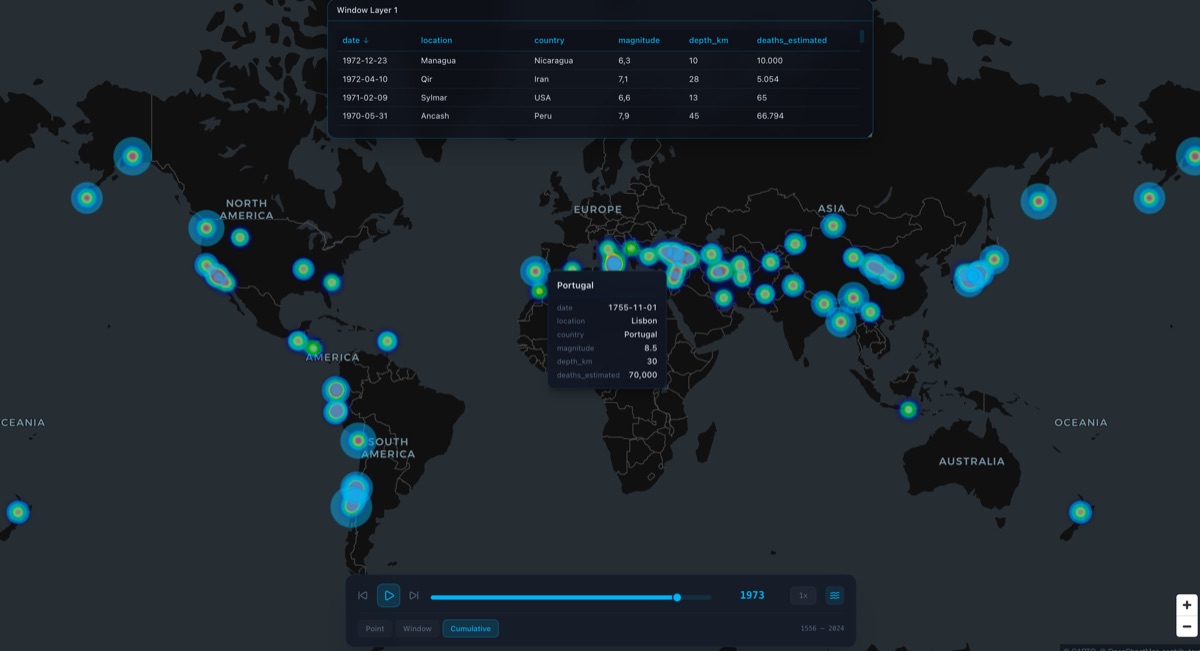
Heatmap
Density-based color blending reveals hotspots. Perfect for earthquake clusters or incident reports.
Text Labels
Annotate the map with dynamic text from your data columns. Show names, values, or custom strings.
Connection Lines
Curved arcs, straight lines, or dashed styles between origin and destination. Optional directional arrows and data-driven line width.
Hub & Spoke
Radial lines from a central hub to satellite locations. Ideal for supply chains or network topologies.
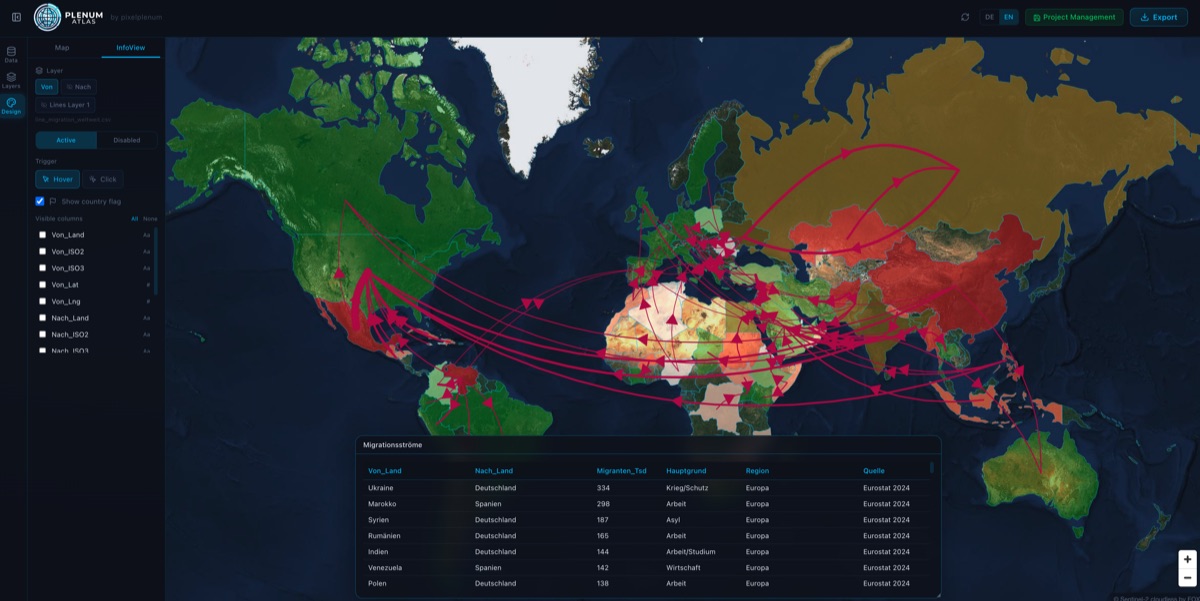
Dashboard Windows
Freely draggable and resizable glassmorphism panels with charts and tables, placed anywhere on the map canvas.
Interactive Dashboard Windows
Drag, resize, and freely position glassmorphism floating panels anywhere on the map canvas. Five window types let you build a full dashboard without leaving the map.
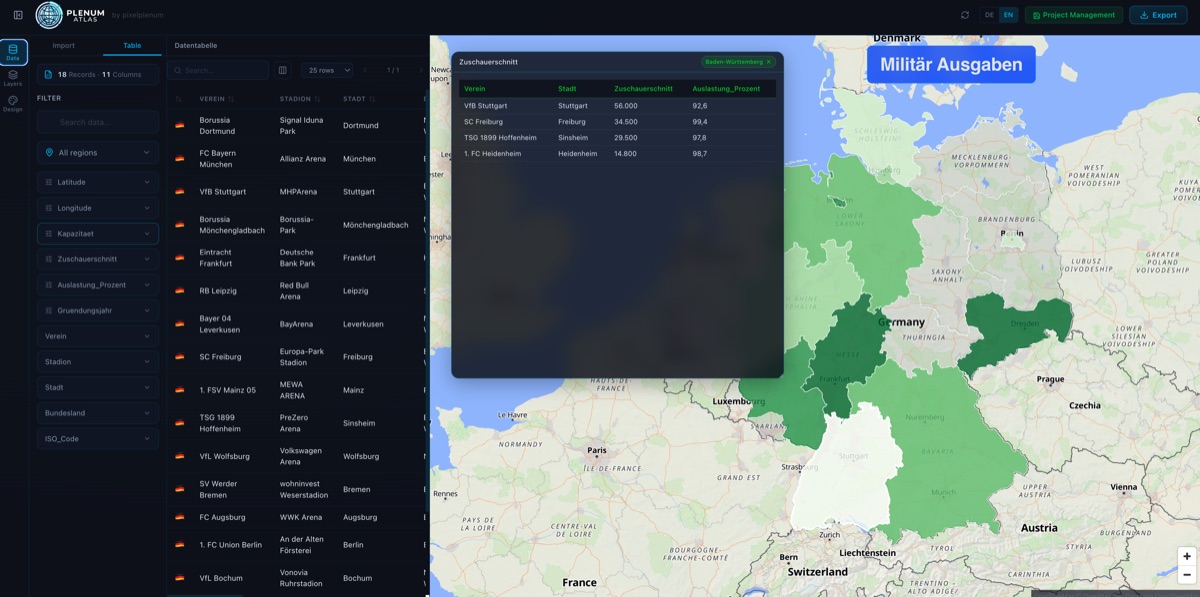
Data Table
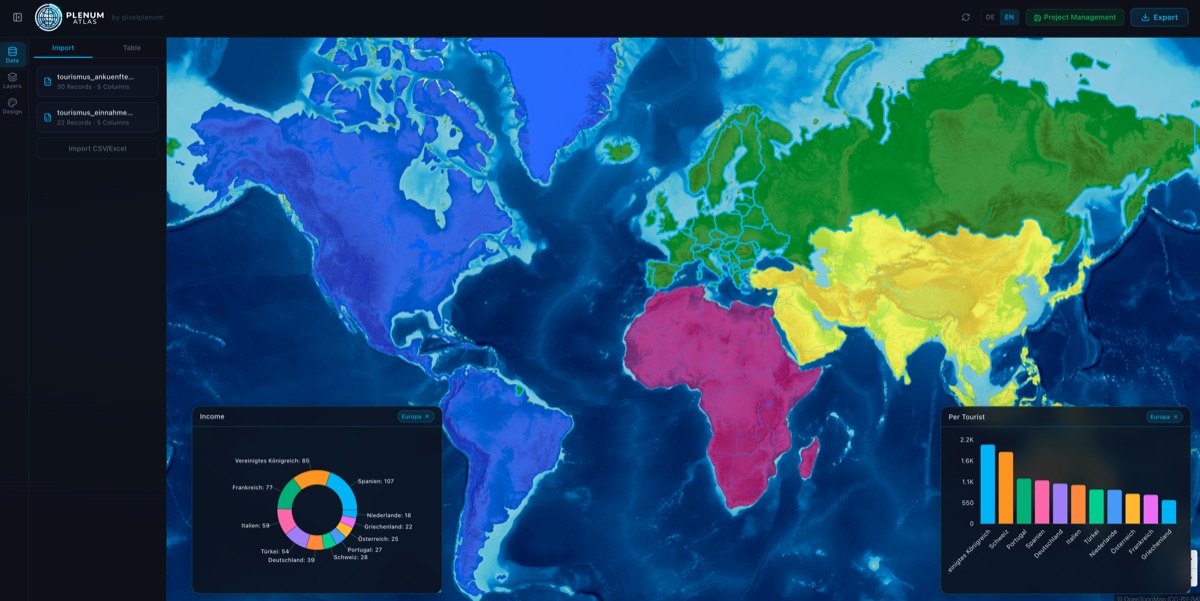
Bar Chart
Line Chart
Pie Chart
KPI Value
Live Map Interaction
Every element on the map is connected to every dashboard window in real time. Click a country on the choropleth and the data table instantly filters to that row. Hover over a region and the KPI window updates with its values.
Filter your raw CSV data by text search, region selection, or value range — the map, table, and all dashboard windows update simultaneously.
No complex queries needed — just click around and discover insights. Every interaction flows from the map to all connected windows.
Map → Dashboard Windows — always in sync
5 Export Formats
From quick screenshots to fully interactive HTML files — share your maps in any format your audience needs.
PNG / JPG
High-res image export
Print-ready documents
PowerPoint
Ready-made slides
Word
Embed in reports
Interactive HTML
See details below
Interactive HTML Export
Export your entire dashboard as a single, self-contained HTML file. No server required — it works offline, in any browser, on any device.
The exported map stays fully interactive: hover tooltips, click-to-filter, draggable dashboard windows — everything works exactly like in the app.
Embed on any Website
Drop the HTML file into your CMS, landing page, or corporate intranet. Web designers get ready-to-use interactive content.
Interactive Presentations
Data analysts can share live dashboards with stakeholders — no PowerPoint limitations, no static screenshots.
Data-Driven Storytelling
Content creators can build interactive map stories that readers explore at their own pace — far more engaging than static infographics.
</> One file. Fully interactive.
100% Local & Private
Your data never leaves your device. Plenum Atlas runs entirely offline — no cloud uploads, no external servers, no tracking.
Process sensitive business data, personal information, or classified datasets with complete confidence. There is nothing to configure and no privacy policy to read — it simply does not connect.
Fully GDPR compliant by design.
See It In Action
Pricing
One-time purchase. No subscription. No recurring fees. Yours forever.
Plenum Atlas Pro
Full version — all features included
- 10 map styles & 8 layer types
- CSV & Excel import
- Export: PNG, PDF, PowerPoint, Word, HTML
- 100% offline & GDPR-compliant
- Free updates included
Payment processed securely by Paddle. Price includes applicable taxes.
User Handbook
Download the complete documentation as PDF — available in English and German.