
 Data video tool · iPhone, iPad & Mac
Chart Race
Turn any ranking into an animated bar chart race video.
Chart Race is the easiest way to create bar chart race videos right on your device. Import your CSV data, preview instantly and export for YouTube, TikTok, Reels or Shorts.

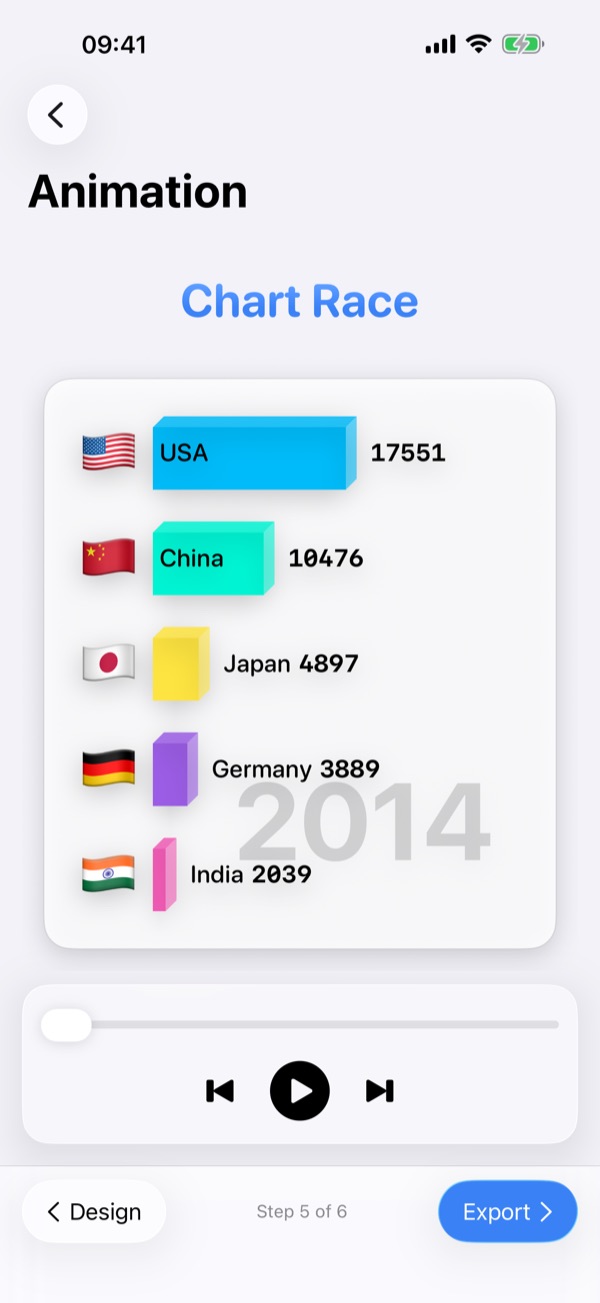
Chart Race in pictures
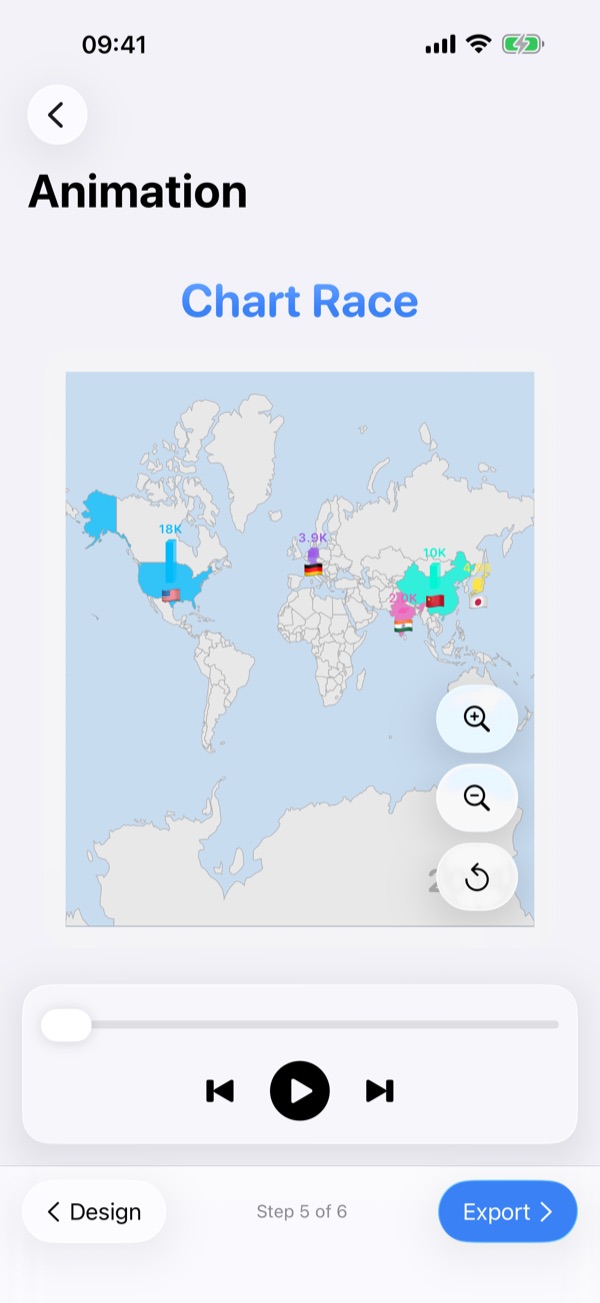
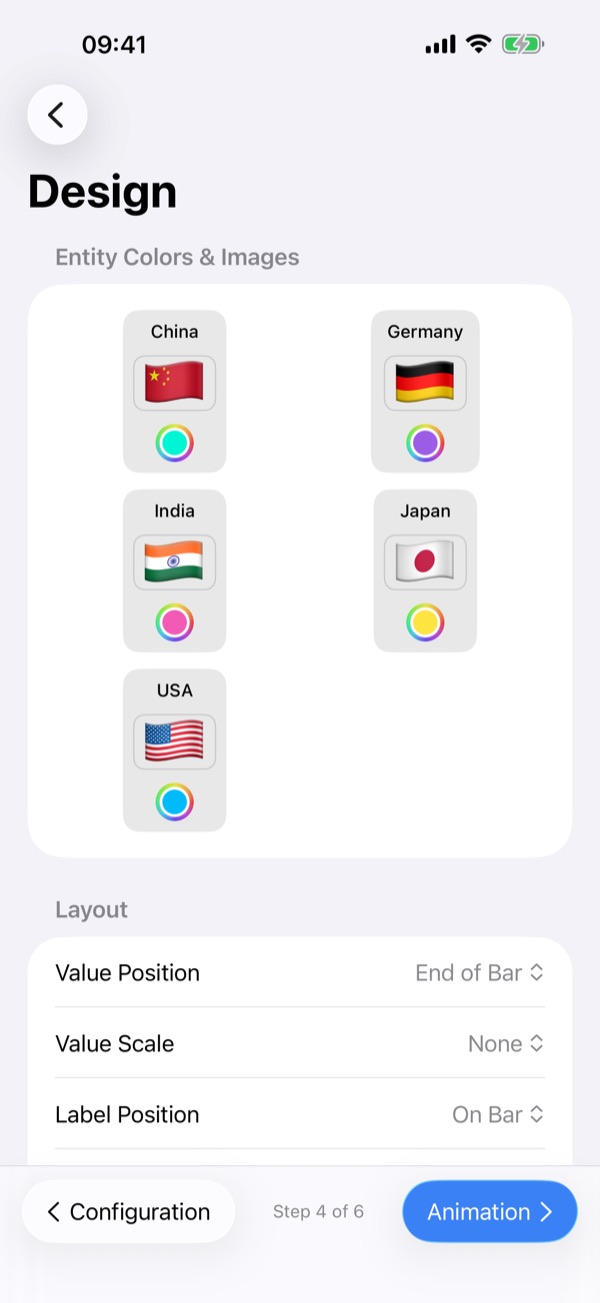

What is Chart Race?
Visualise historical data, sports statistics or financial trends: load your own CSV file with discrete or cumulative values, then adjust colours, image labels, speed, bar count and layout – and switch between a clean 2D look and a 3D perspective.
Export in landscape 16:9 for YouTube or in portrait 9:16 for TikTok, Reels and Shorts. Your data stays on your device – no cloud upload required.
Why you'll like Chart Race
Easy CSV import
Load your own data – discrete or cumulative values.
Instant preview
See the animation immediately, without rendering.
2D or 3D
Toggle between a minimalist 2D style and a 3D perspective.
Full customisation
Colours, image labels, animation speed, number of bars and layouts.
Export for every platform
Landscape 16:9 for YouTube or portrait 9:16 for TikTok, Reels and Shorts.
Privacy first
Your data stays on your device – nothing is uploaded.
Frequently asked questions
What is a bar chart race?
An animated bar chart in which the bars re-order over time as the values change – a popular way to show rankings such as population, GDP or sports records over the years.
Is Chart Race free?
Yes, you can download and try it for free. The free version adds a watermark to exported videos and limits the number of data rows; a one-time Pro purchase removes both.
What data do I need?
A CSV file with your categories and their values over time. Chart Race supports both discrete and cumulative data.
Can I export vertical videos?
Yes – portrait 9:16 for TikTok, Reels and Shorts, or landscape 16:9 for YouTube.
Get Chart Race
Free · Pro via one-time purchase
Learn how it works
More apps & games