
How to visualize country data on a 3D globe
A rotating 3D Earth is one of the most striking ways to present global data – in a keynote, on a website or on a trade-show screen. This guide shows how to prepare your data and build a globe that is beautiful and still easy to read.
When does a 3D globe make sense?
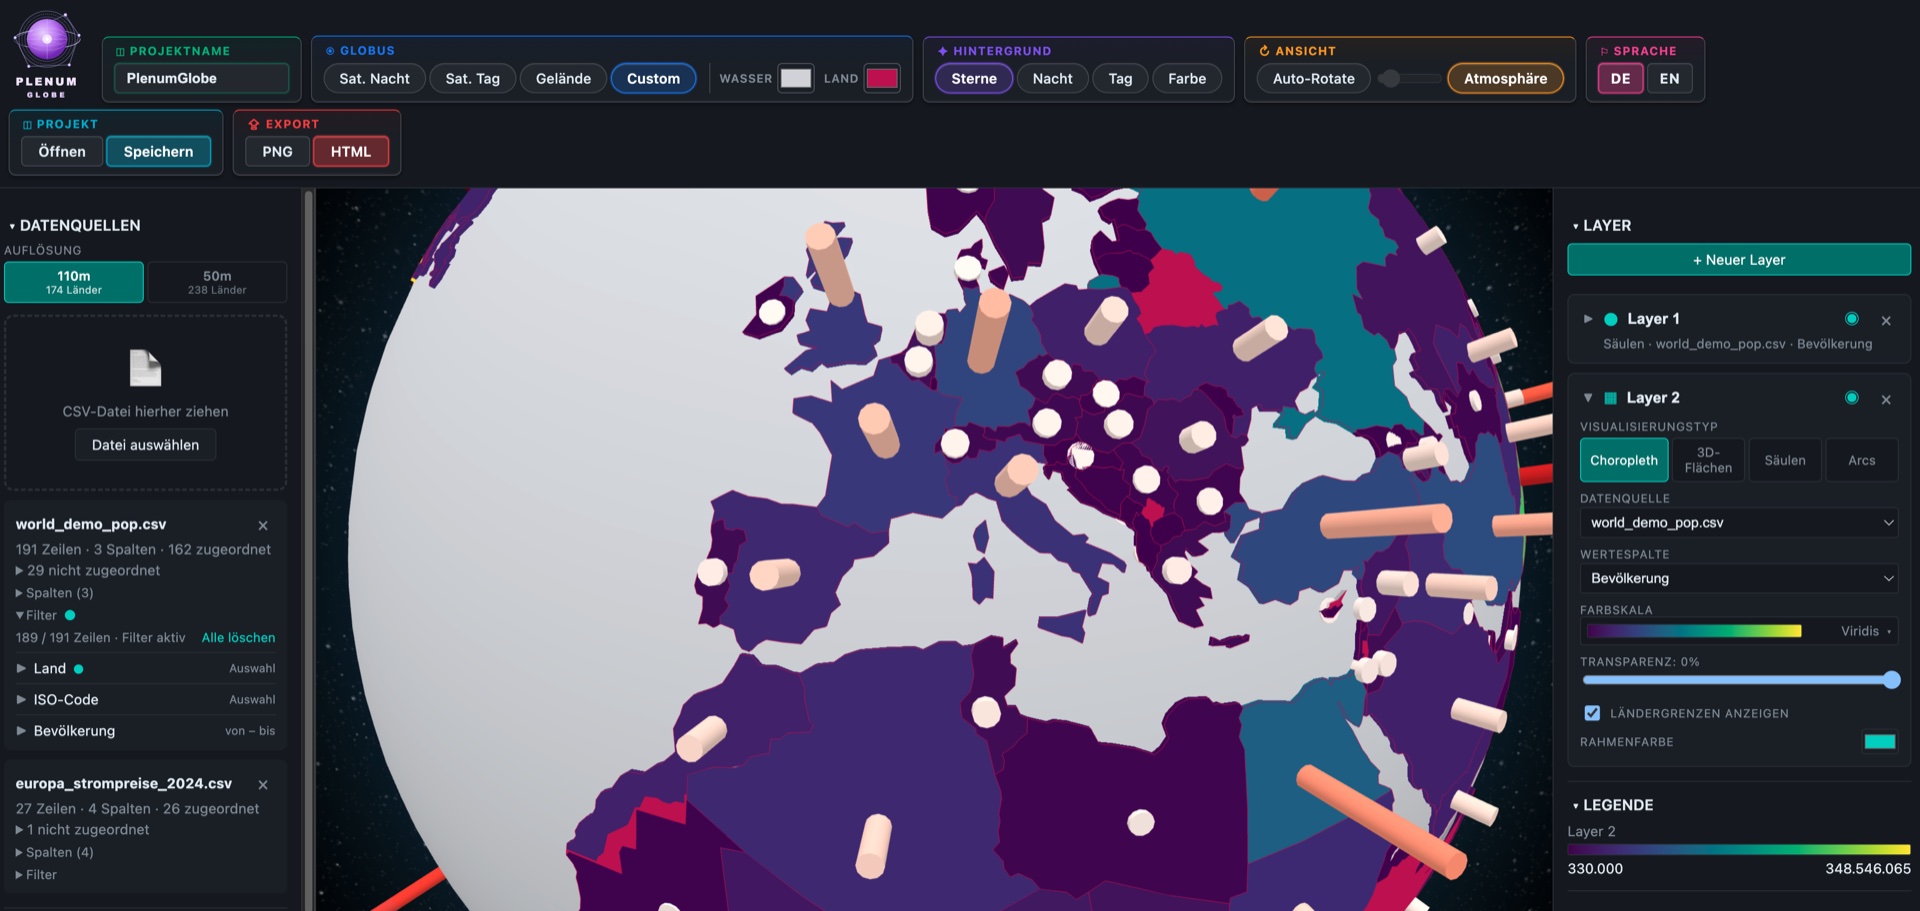
Globes shine when the story is global and spatial: flight routes and trade flows across oceans, migration between continents, or a worldwide indicator you want to present with impact. Because only one hemisphere is visible at a time, a globe is less suited to precise side-by-side comparisons of distant countries – for those, a flat map or a chart is often clearer.
Four ways to show data on a globe
| Mode | Best for | Data you need |
|---|---|---|
| Choropleth | Rates and indicators per country | Country + value |
| 3D columns | Wide value ranges, magnitudes | Country + value |
| Points | Cities, sites, sensors, events | Latitude + longitude (or country) |
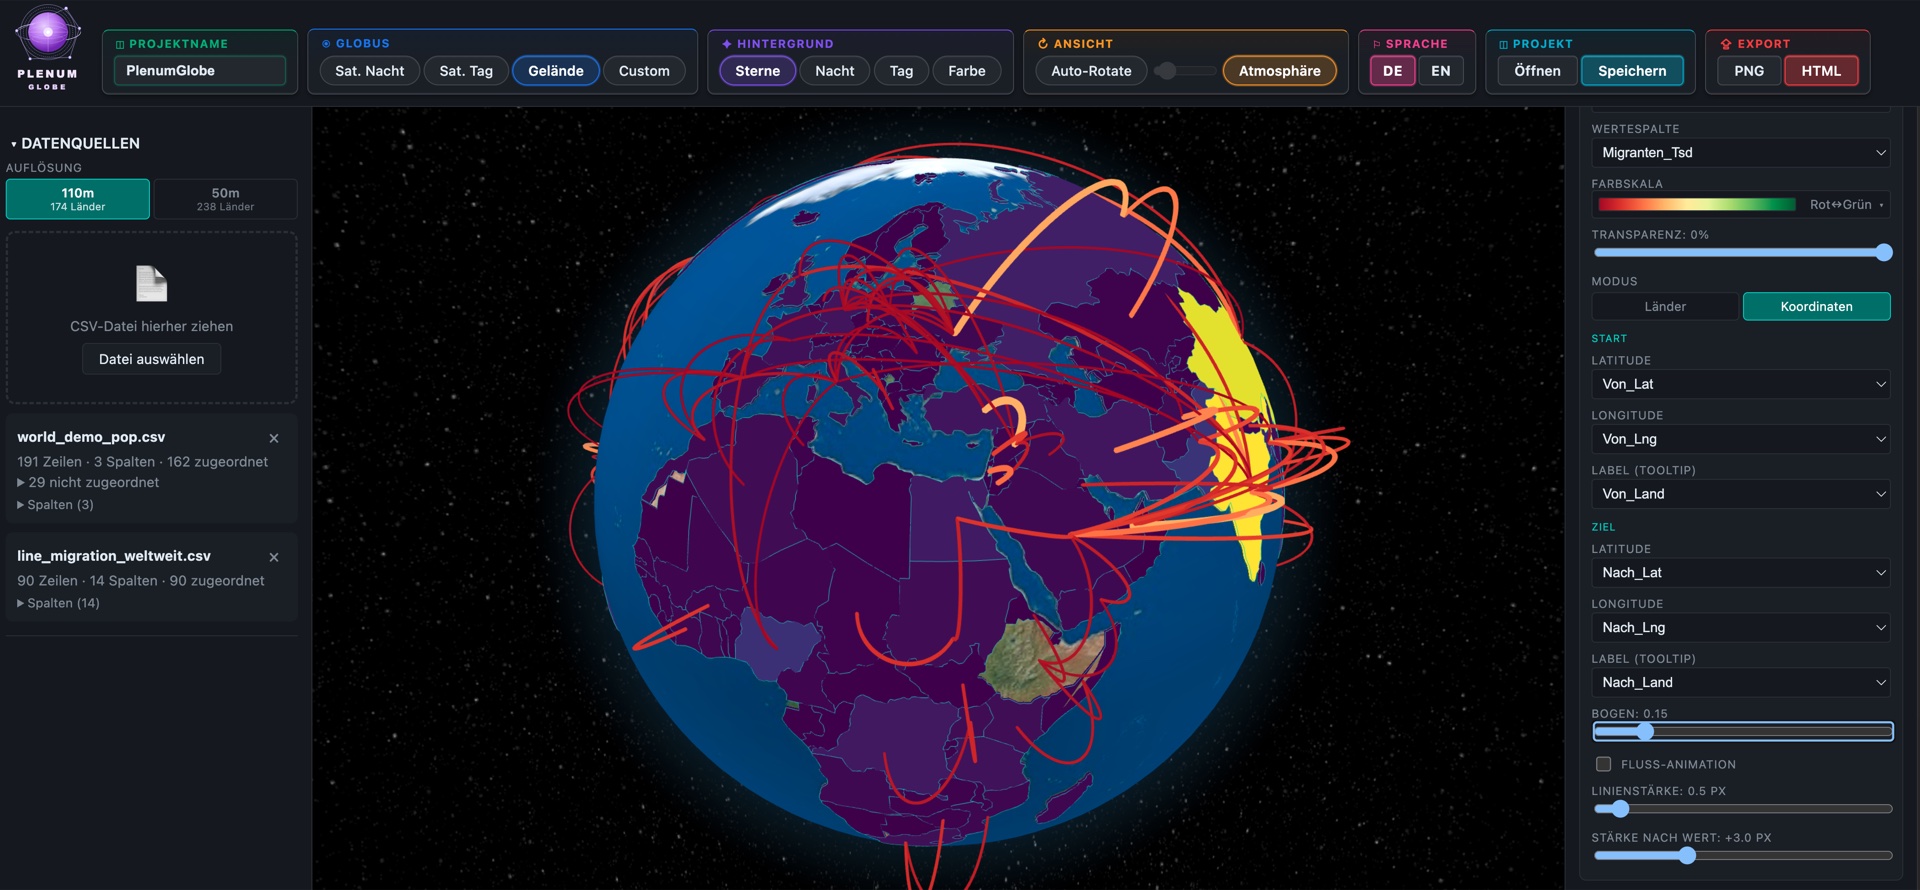
| Arcs | Routes, flows, connections | Origin country + destination country |
Step 1: Prepare a CSV file
- Identify countries clearly. ISO alpha-2, alpha-3 or numeric codes are safest. Plenum Globe also matches names and ignores accents and prefixes like "The" or "Republic of".
- For points, add coordinates. Separate latitude and longitude columns in decimal degrees (for example 52.52 and 13.40 for Berlin).
- For arcs, use two country columns – one for the origin, one for the destination – plus an optional value for the line weight.
- Delimiter and decimals don't matter much. Comma, semicolon or tab separators and both decimal points and decimal commas are detected automatically.
Step 2: Import and check the matching
Drag the CSV into Plenum Globe. The import wizard previews the first rows, detects the role of each column (country name, ISO code, latitude, longitude, number, date) and shows a live result such as "183 / 190 matched". Fix the few unmatched rows by switching the key column or correcting a spelling – no need to re-import.
You can try the whole workflow in the free Plenum Globe web demo before installing anything.
Step 3: Build the scene
- Add a layer and choose its mode: choropleth, 3D columns, points or arcs. Layers can be combined – for example population as a choropleth with flight routes as arcs on top.
- Pick a colour palette. Plenum Globe offers 19 palettes – sequential, multi-colour scales like Viridis or Inferno, and diverging scales – plus custom palettes.
- Choose a globe texture: NASA Black Marble (night lights), Blue Marble (daytime satellite), topographic terrain or a plain two-colour texture that matches your brand.
- Set the background and atmosphere and, for screens and kiosks, turn on auto-rotation.
Design tips for readable globes
- One message per scene. Two layers are usually plenty; more makes the globe noisy.
- Let the legend do its job. Keep a visible legend with min and max values and a clear unit.
- Use columns for magnitude, colour for rates. Tall columns emphasise size; colour is better for comparing percentages.
- Start the camera on your story. Rotate the globe so the most important region faces the viewer before you export.
Step 4: Export
Export a PNG of the globe for slides, social media and print, or a standalone HTML file that stays rotatable, zoomable and keeps its tooltips – it opens in any browser, works offline and can be embedded in a website or blog. Projects are saved as .plenumglobe files so you can continue editing later.
Frequently asked questions
Do I need programming skills to build a 3D globe?
No. Plenum Globe gives you a user interface for all settings – import a CSV, choose a mode and style the globe. The HTML export is built on react-globe.gl, so developers can still work with the result.
Which countries and borders are included?
244 countries based on Natural Earth data in three resolutions (110 m, 50 m and 10 m), so you can switch between a fast overview and detailed borders.
Can I use the globe on my website?
Yes. The standalone HTML export is a single file with everything inline – no server or build tools required – which you can upload or embed.
Does it work offline?
Yes. Plenum Globe runs fully offline after the first activation; your data stays on your device.